Security score and open risk
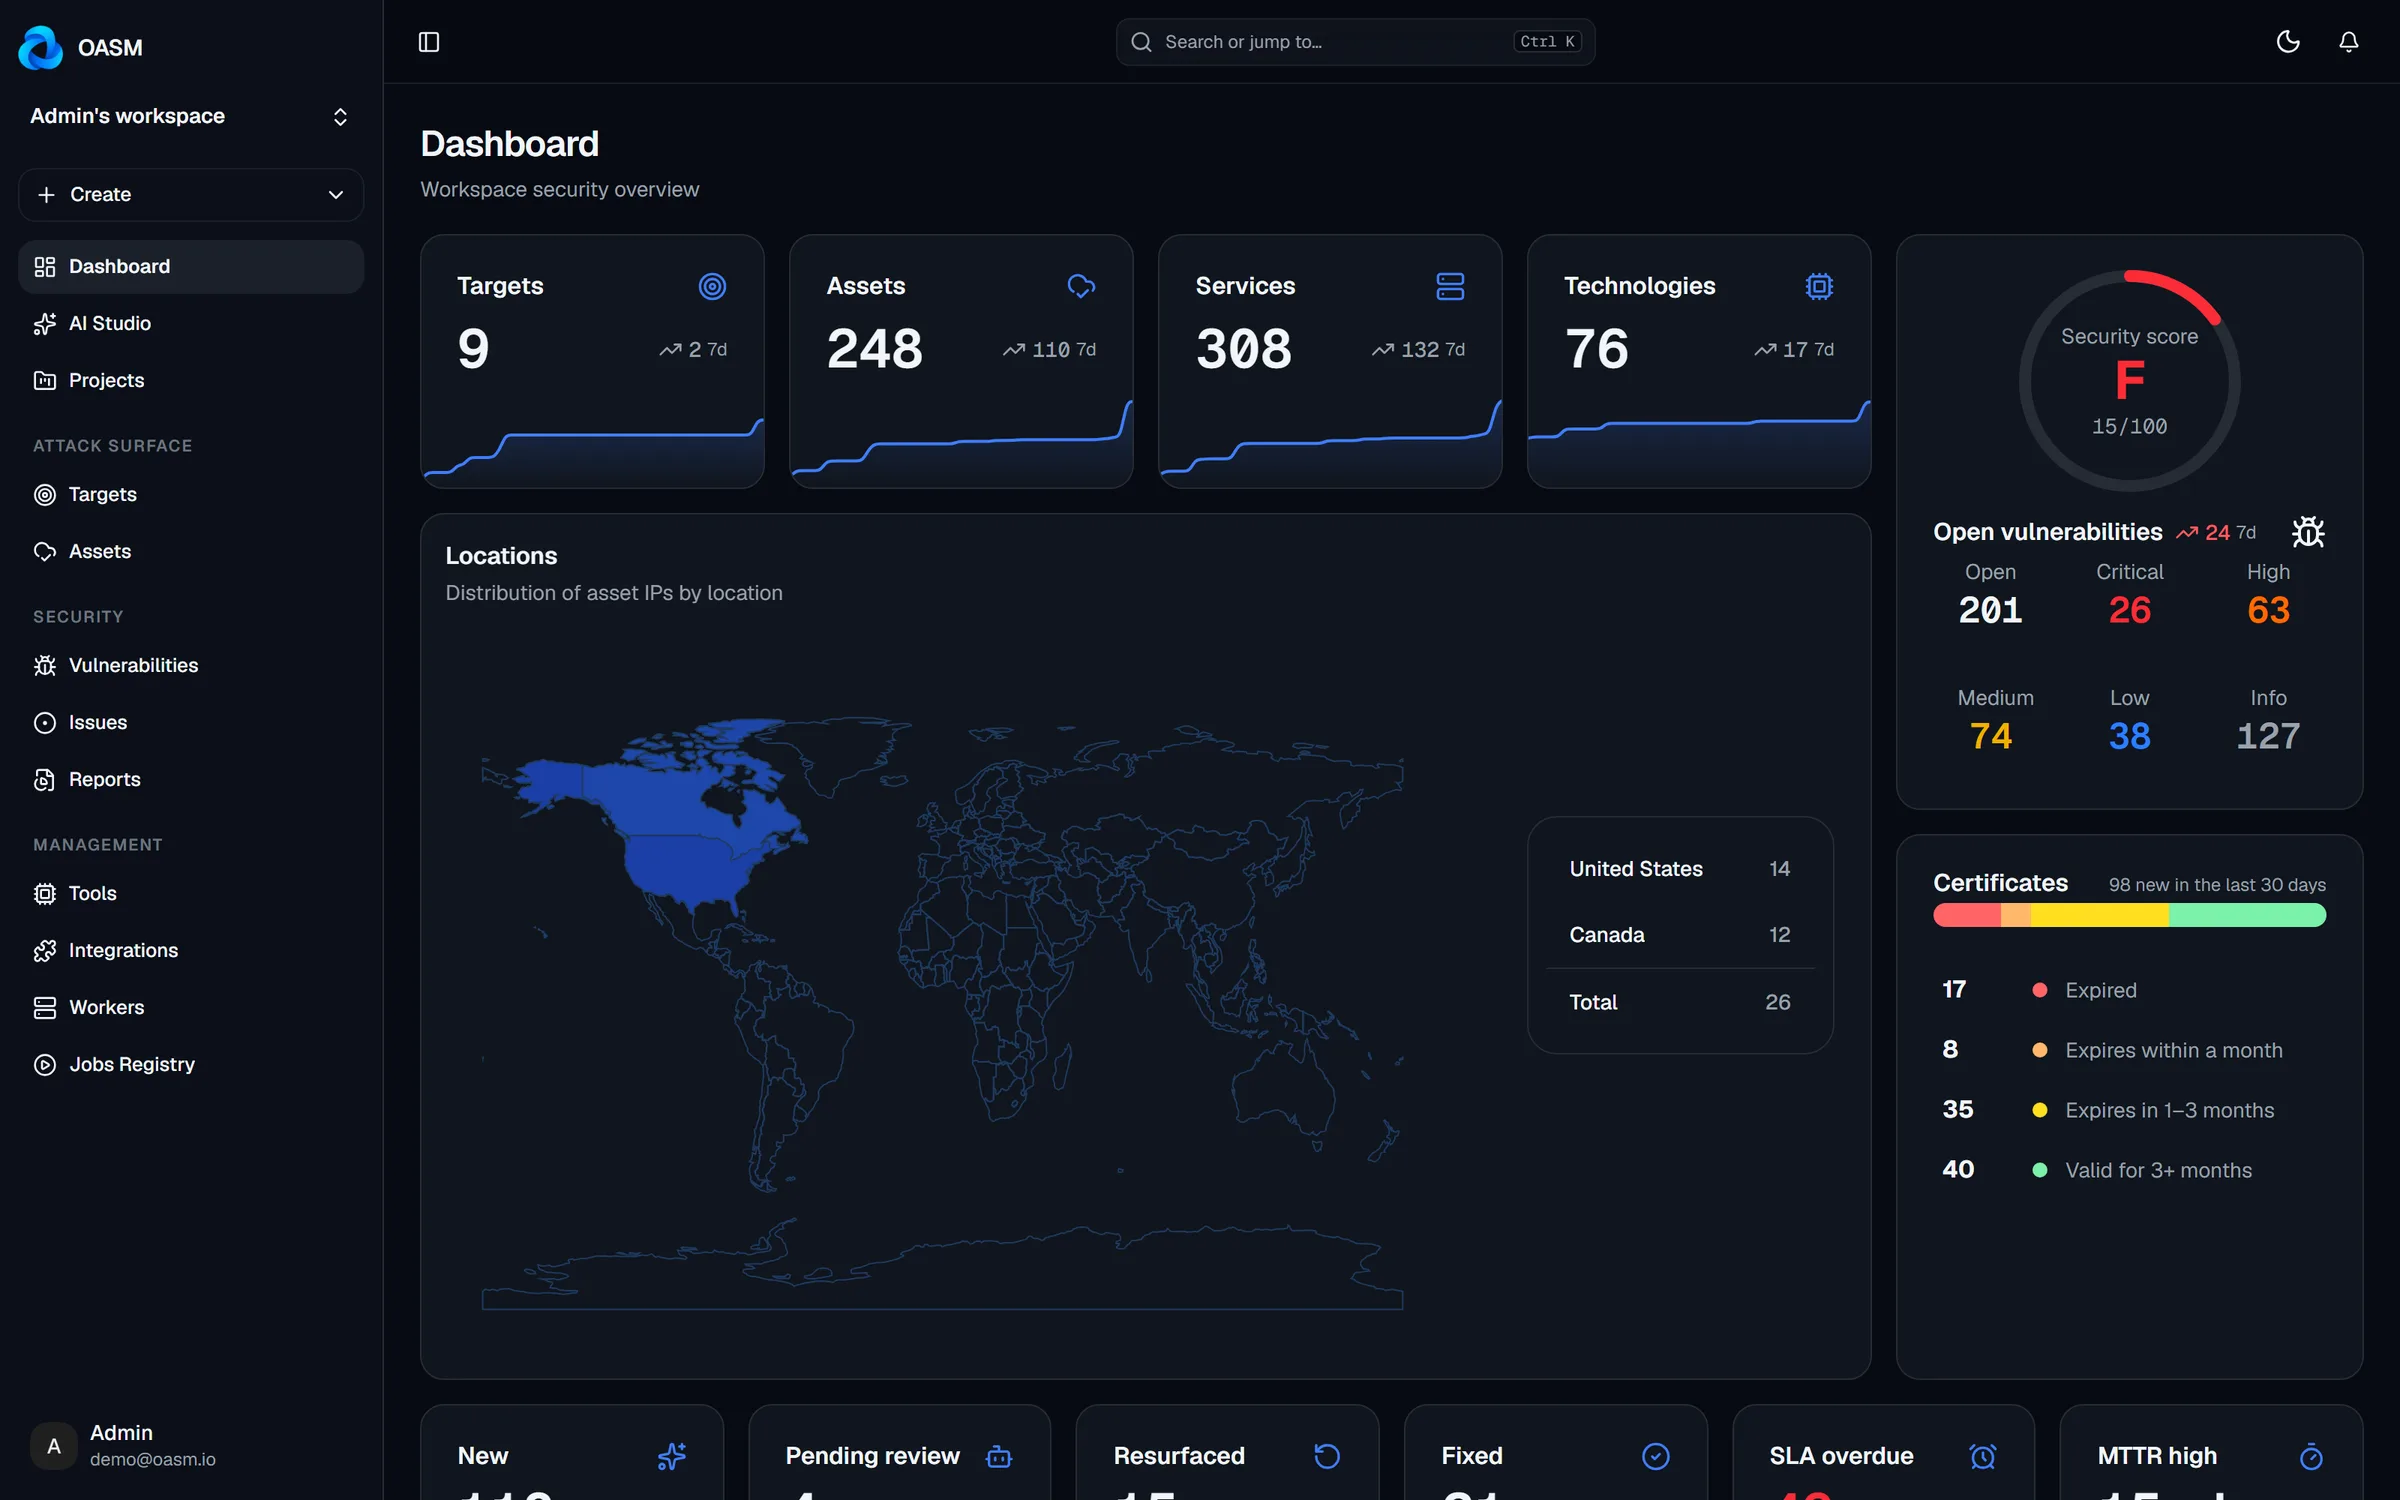
Grade, open vulnerabilities by severity and certificate health.
A live dashboard with a security score, open vulnerabilities, certificate health and what needs attention — plus PDF reports when someone needs it on paper.
✓ A–F security score✓ Needs-attention list✓ PDF reports
THE PROBLEM
Leadership asks "are we safer than last month?" Most teams answer with a slide built by hand. OASM answers with live data.
Assets, services, findings and certificates update the dashboard continuously.
A security score and needs-attention list highlight what changed.
Send a PDF report or open the project scorecard in the meeting.
From the security score down to the certificate that expires next week.
Grade, open vulnerabilities by severity and certificate health.
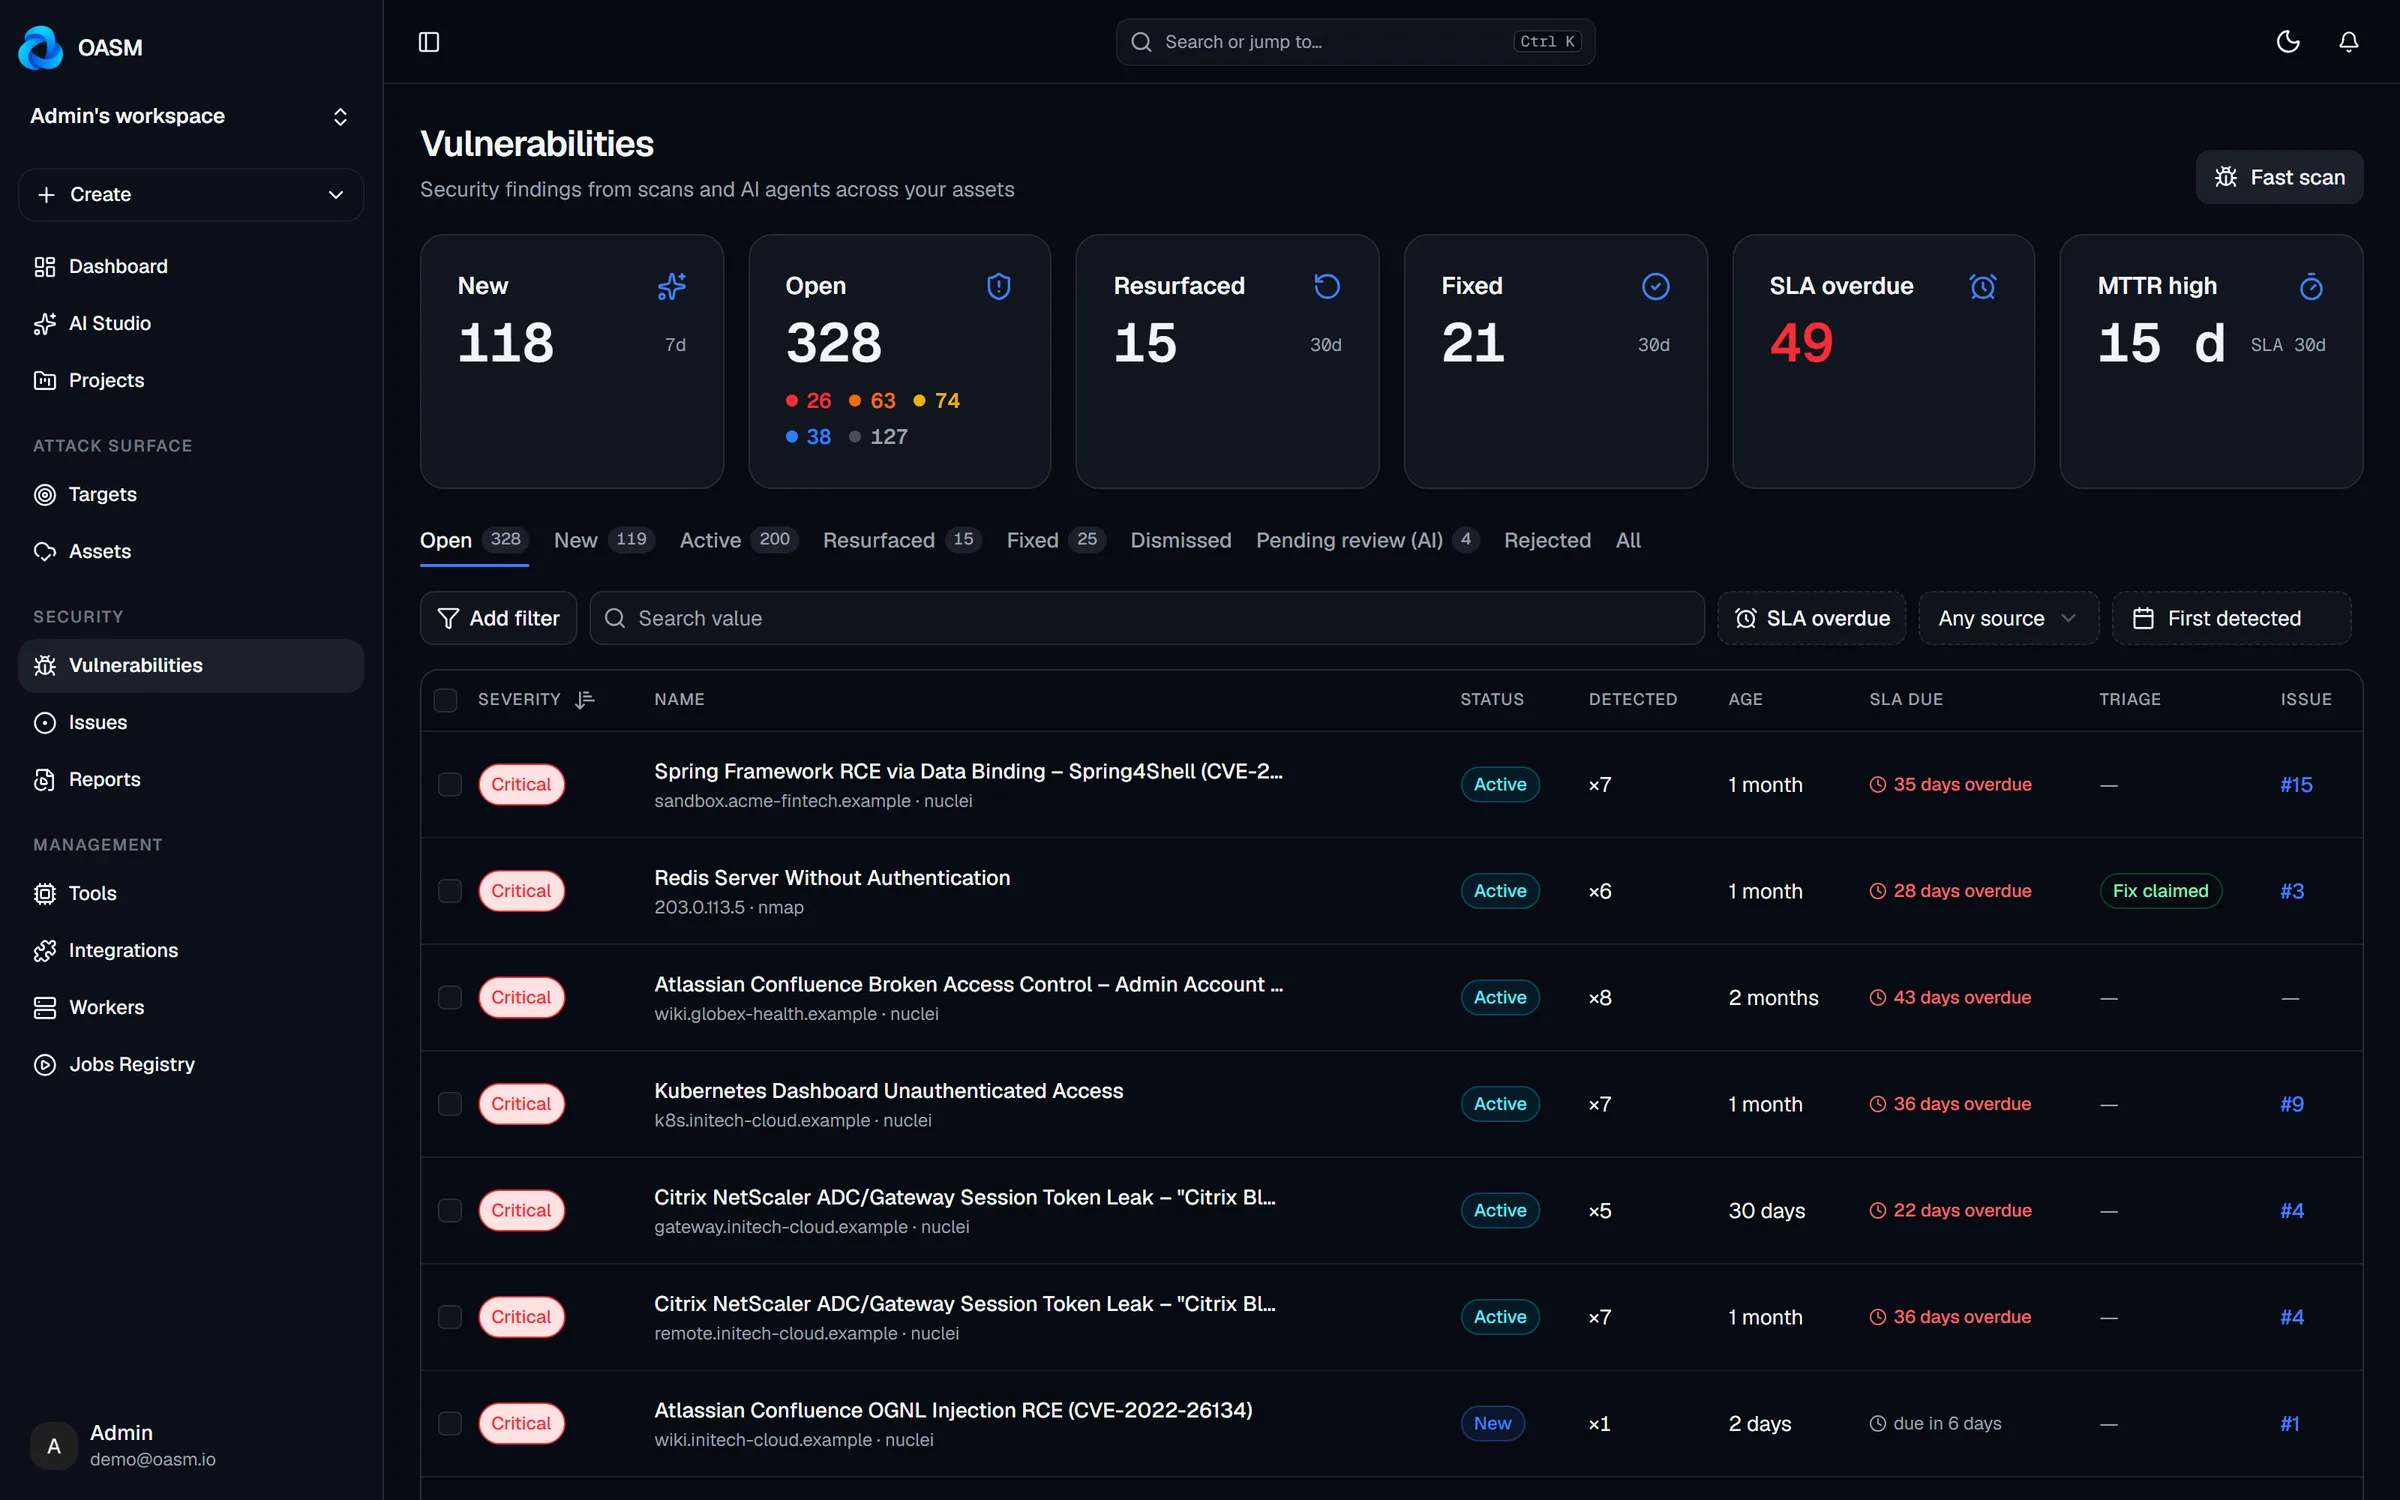
New findings per week and what to fix first.
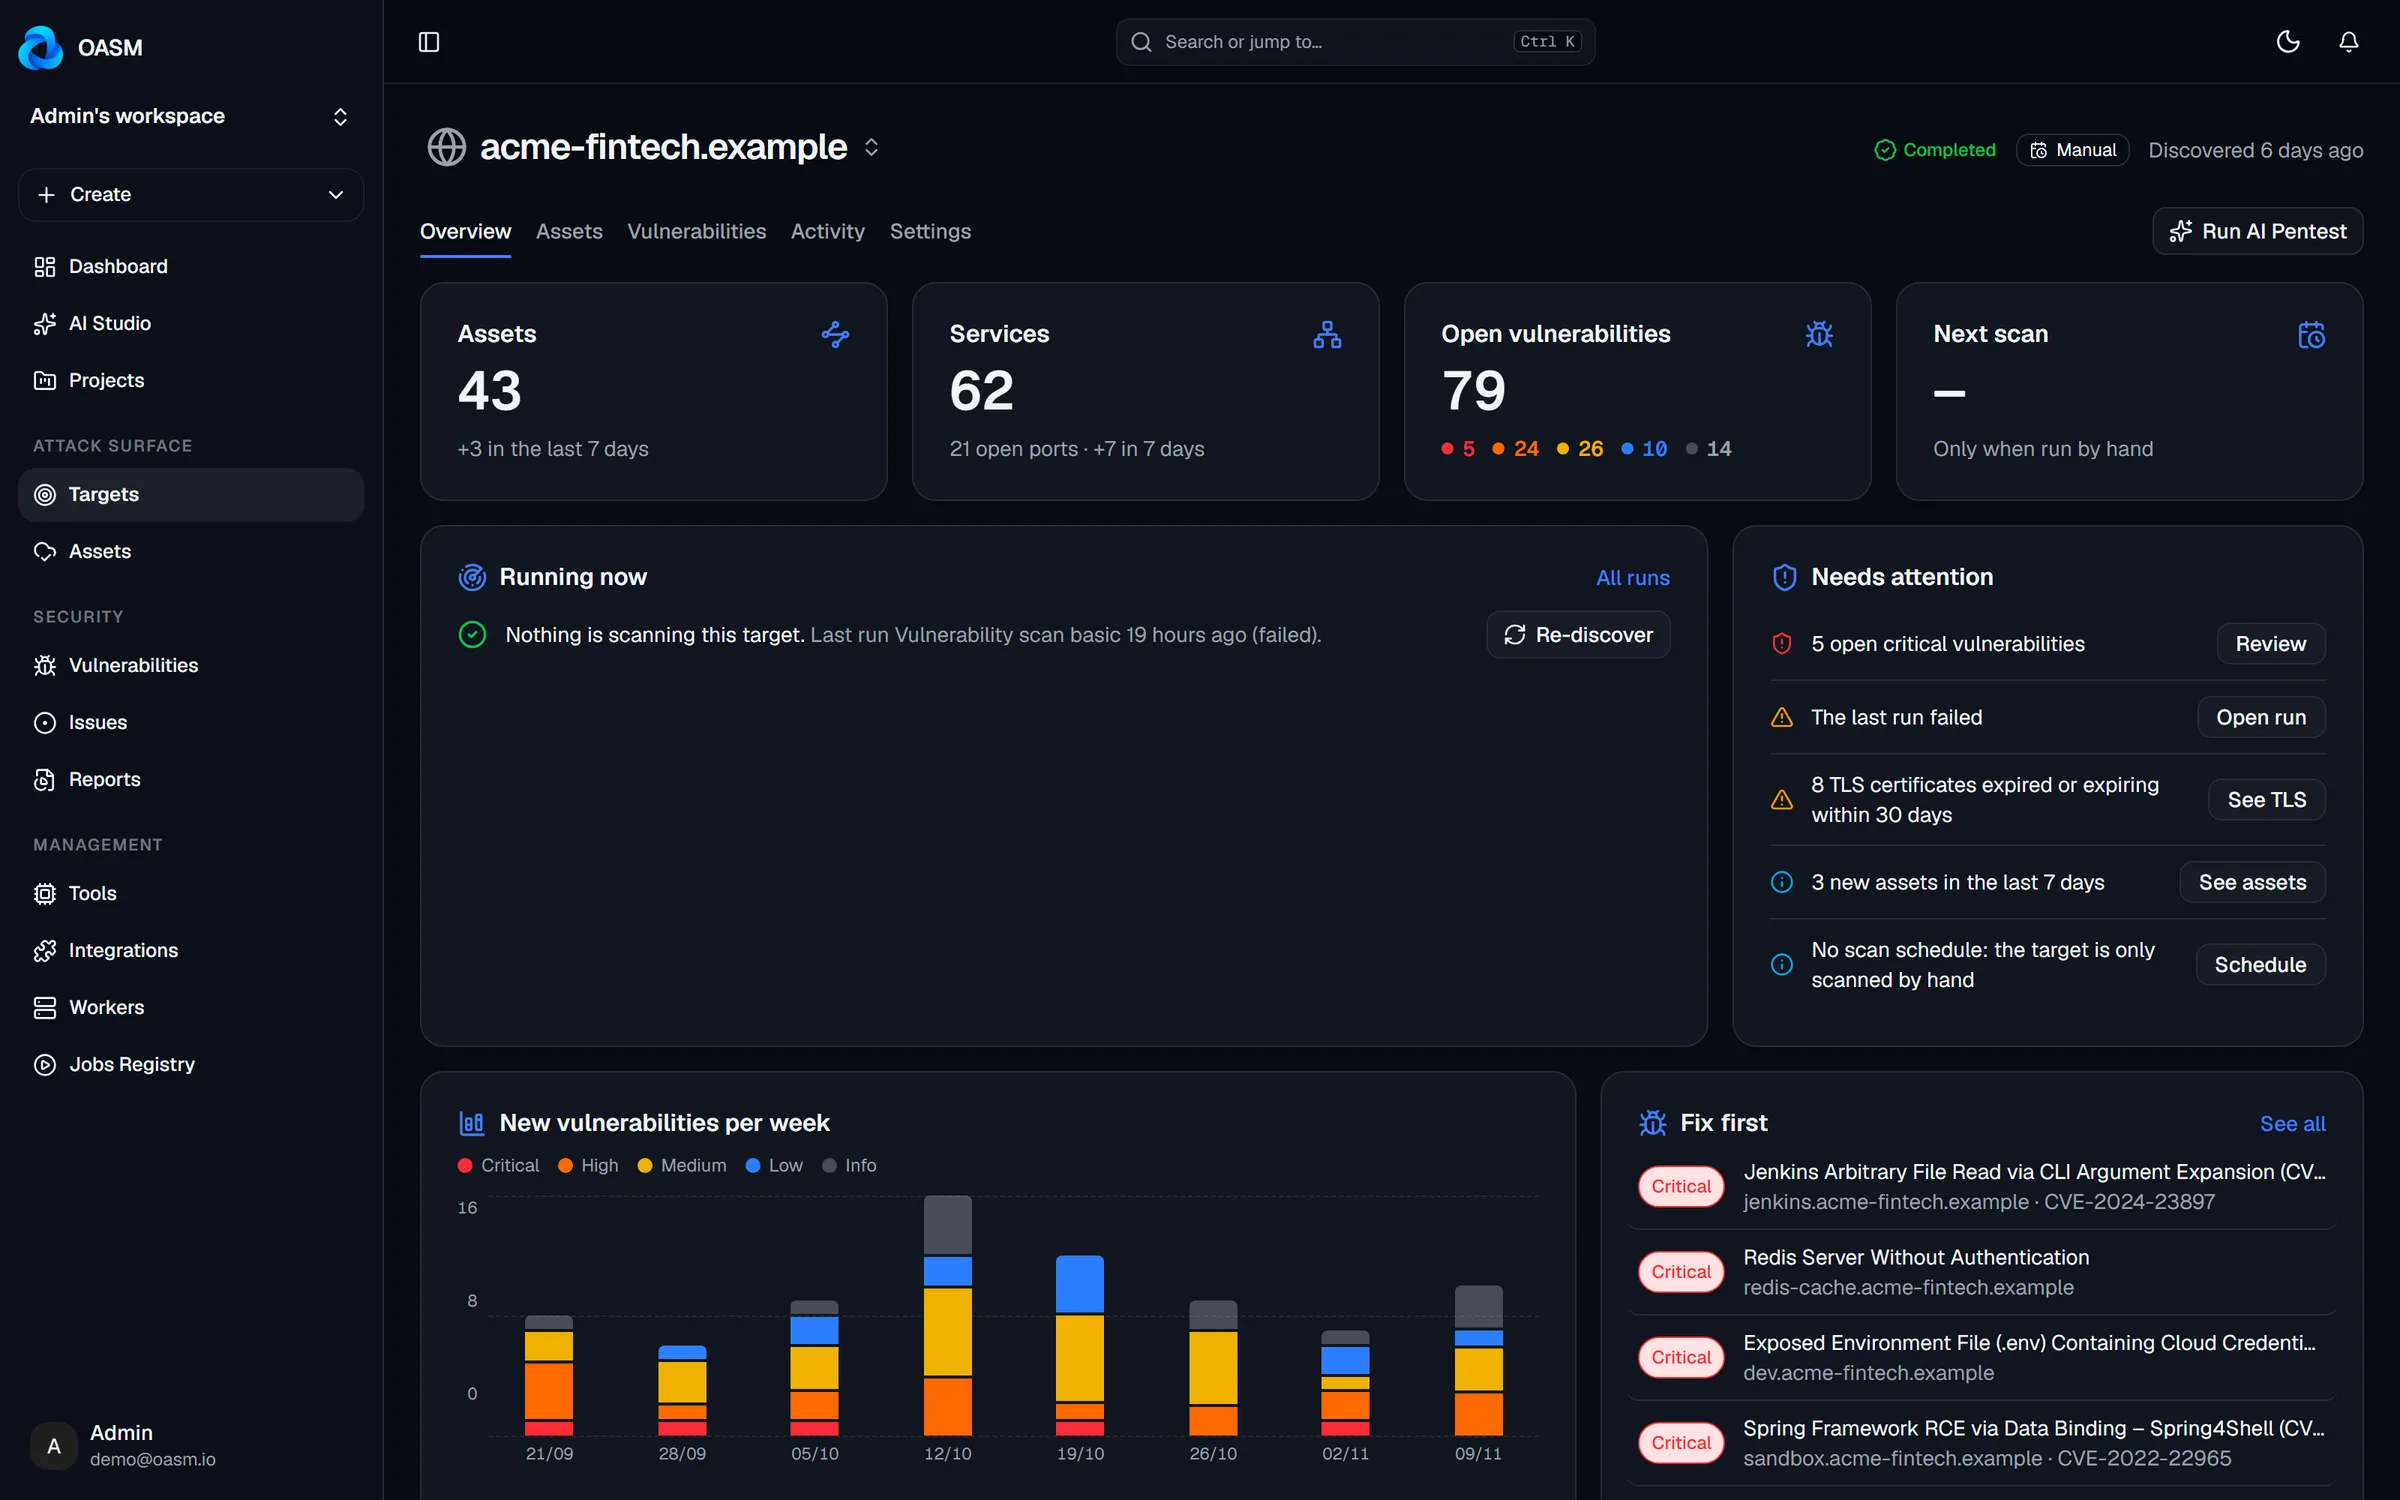
Critical, past-SLA, failed runs and stale targets.
Expired, expiring and valid at a glance.
Where your exposed infrastructure is hosted.
Share a point-in-time snapshot.
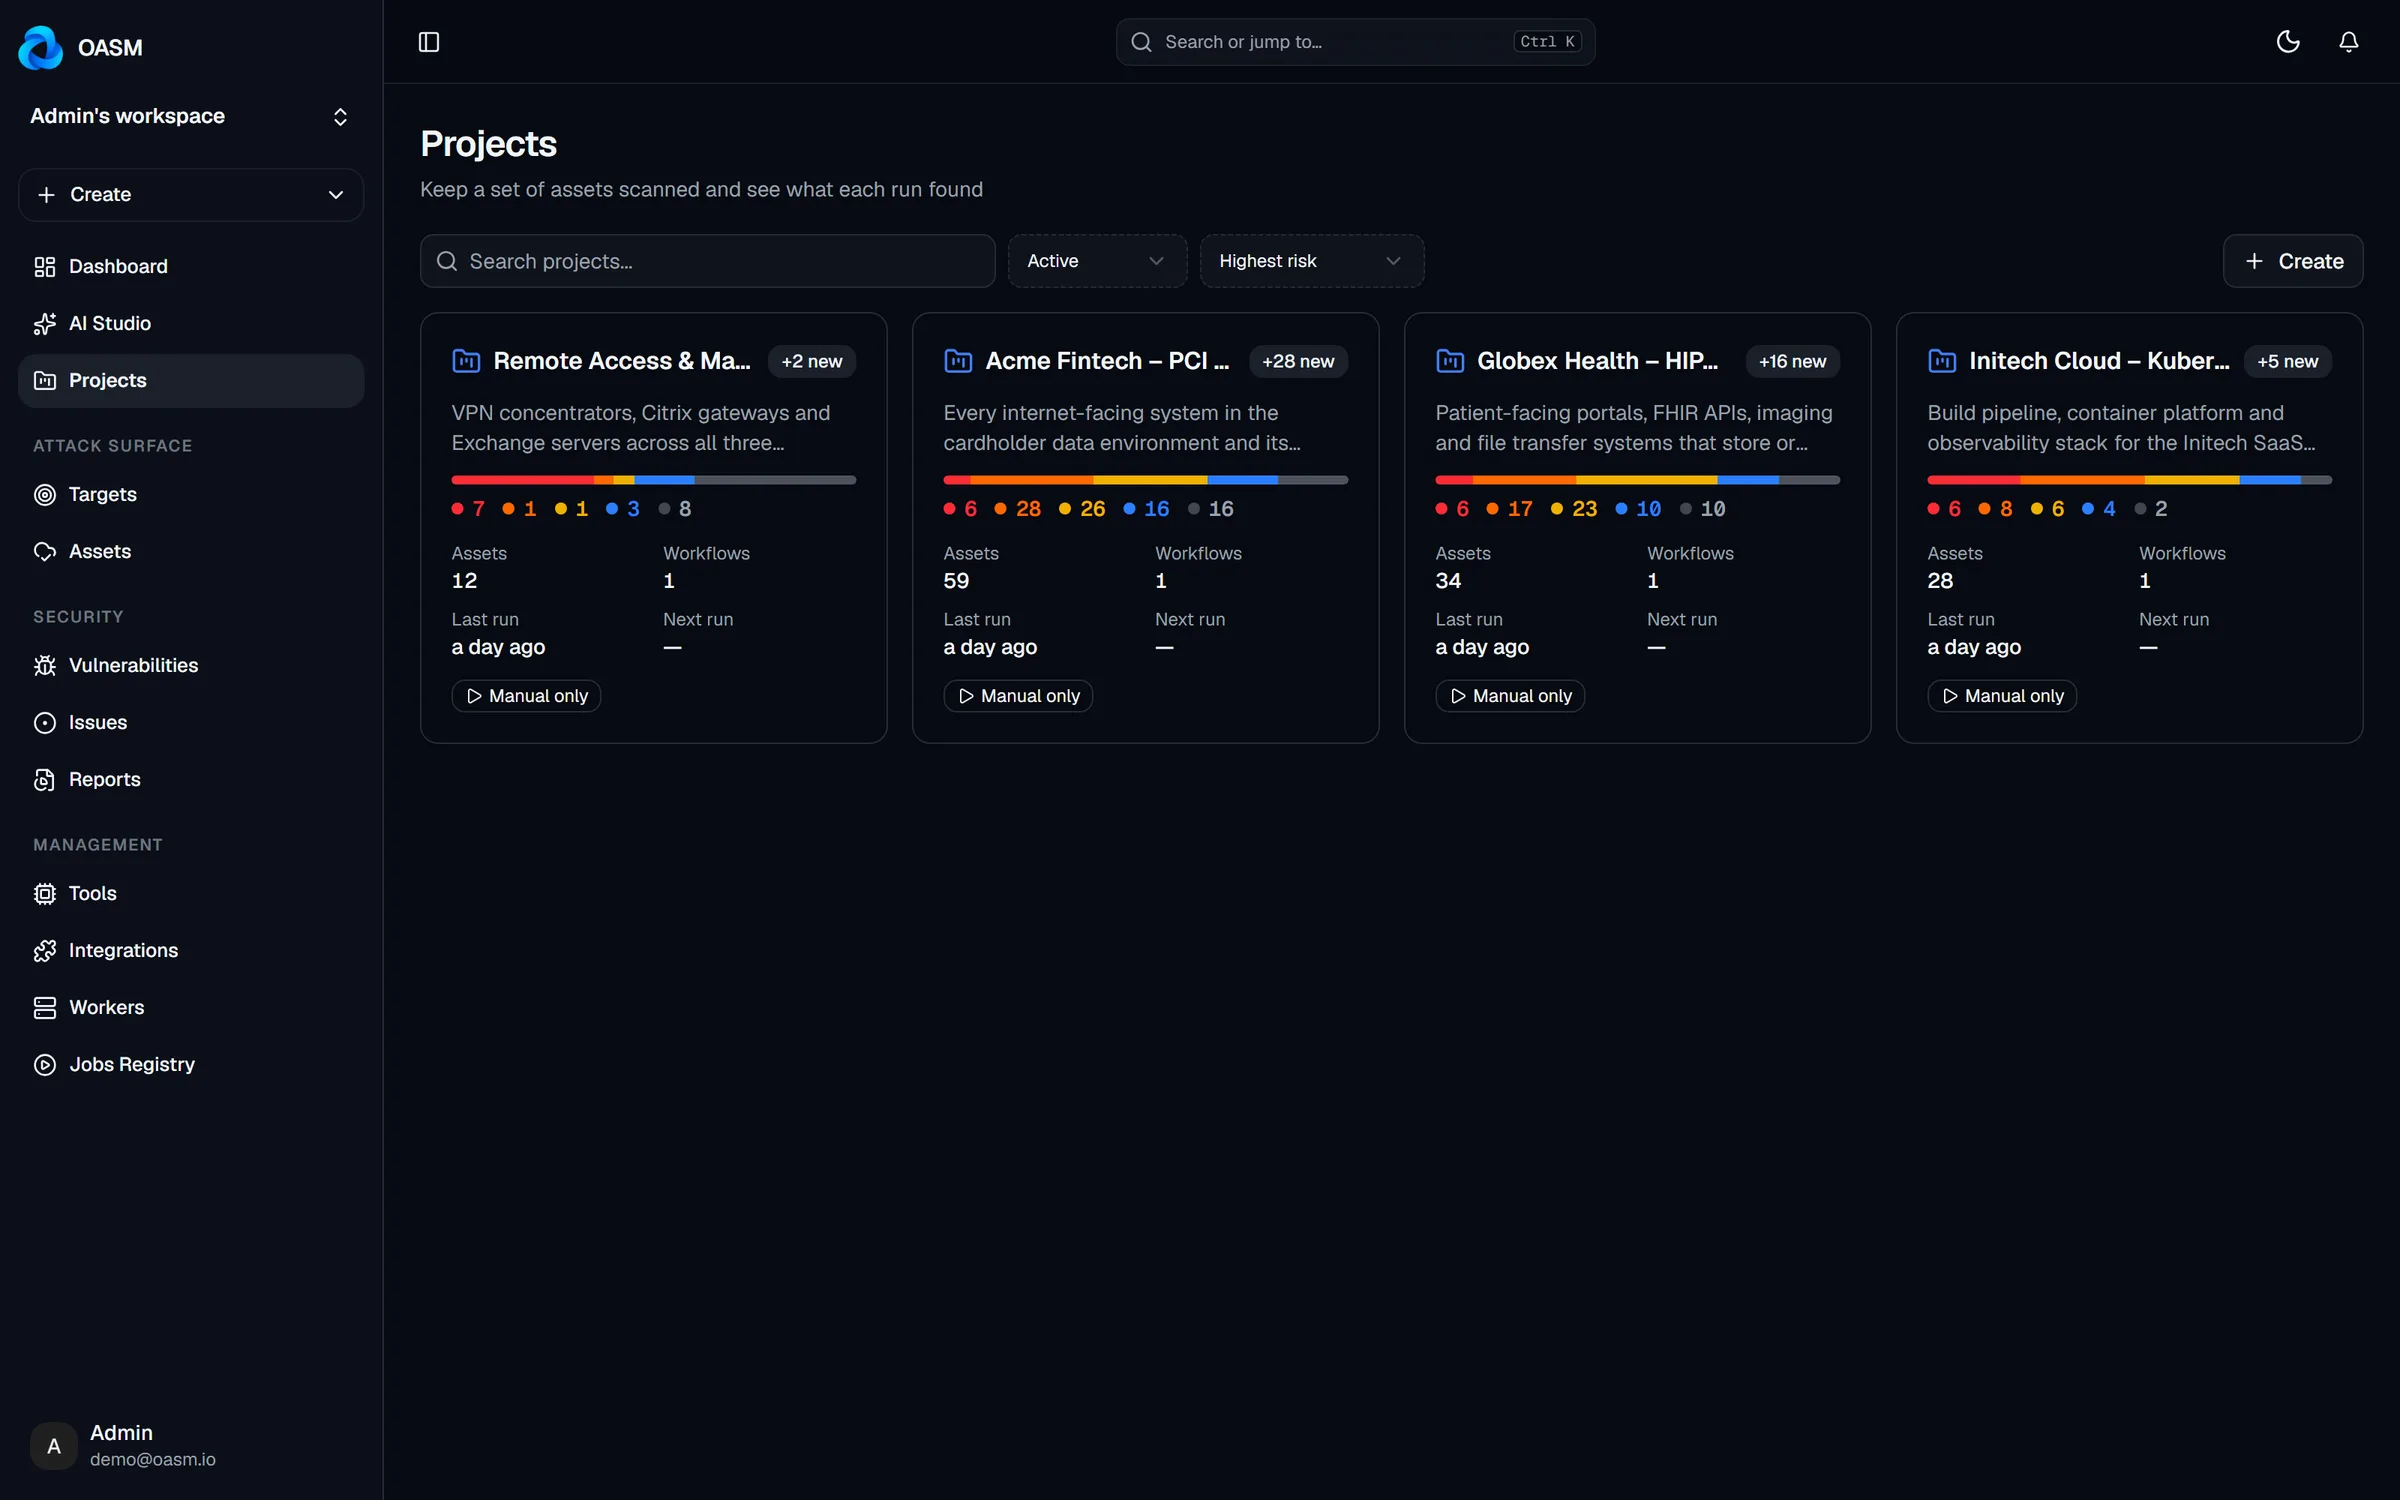
New findings per week, SLA status and what to fix first — per project.
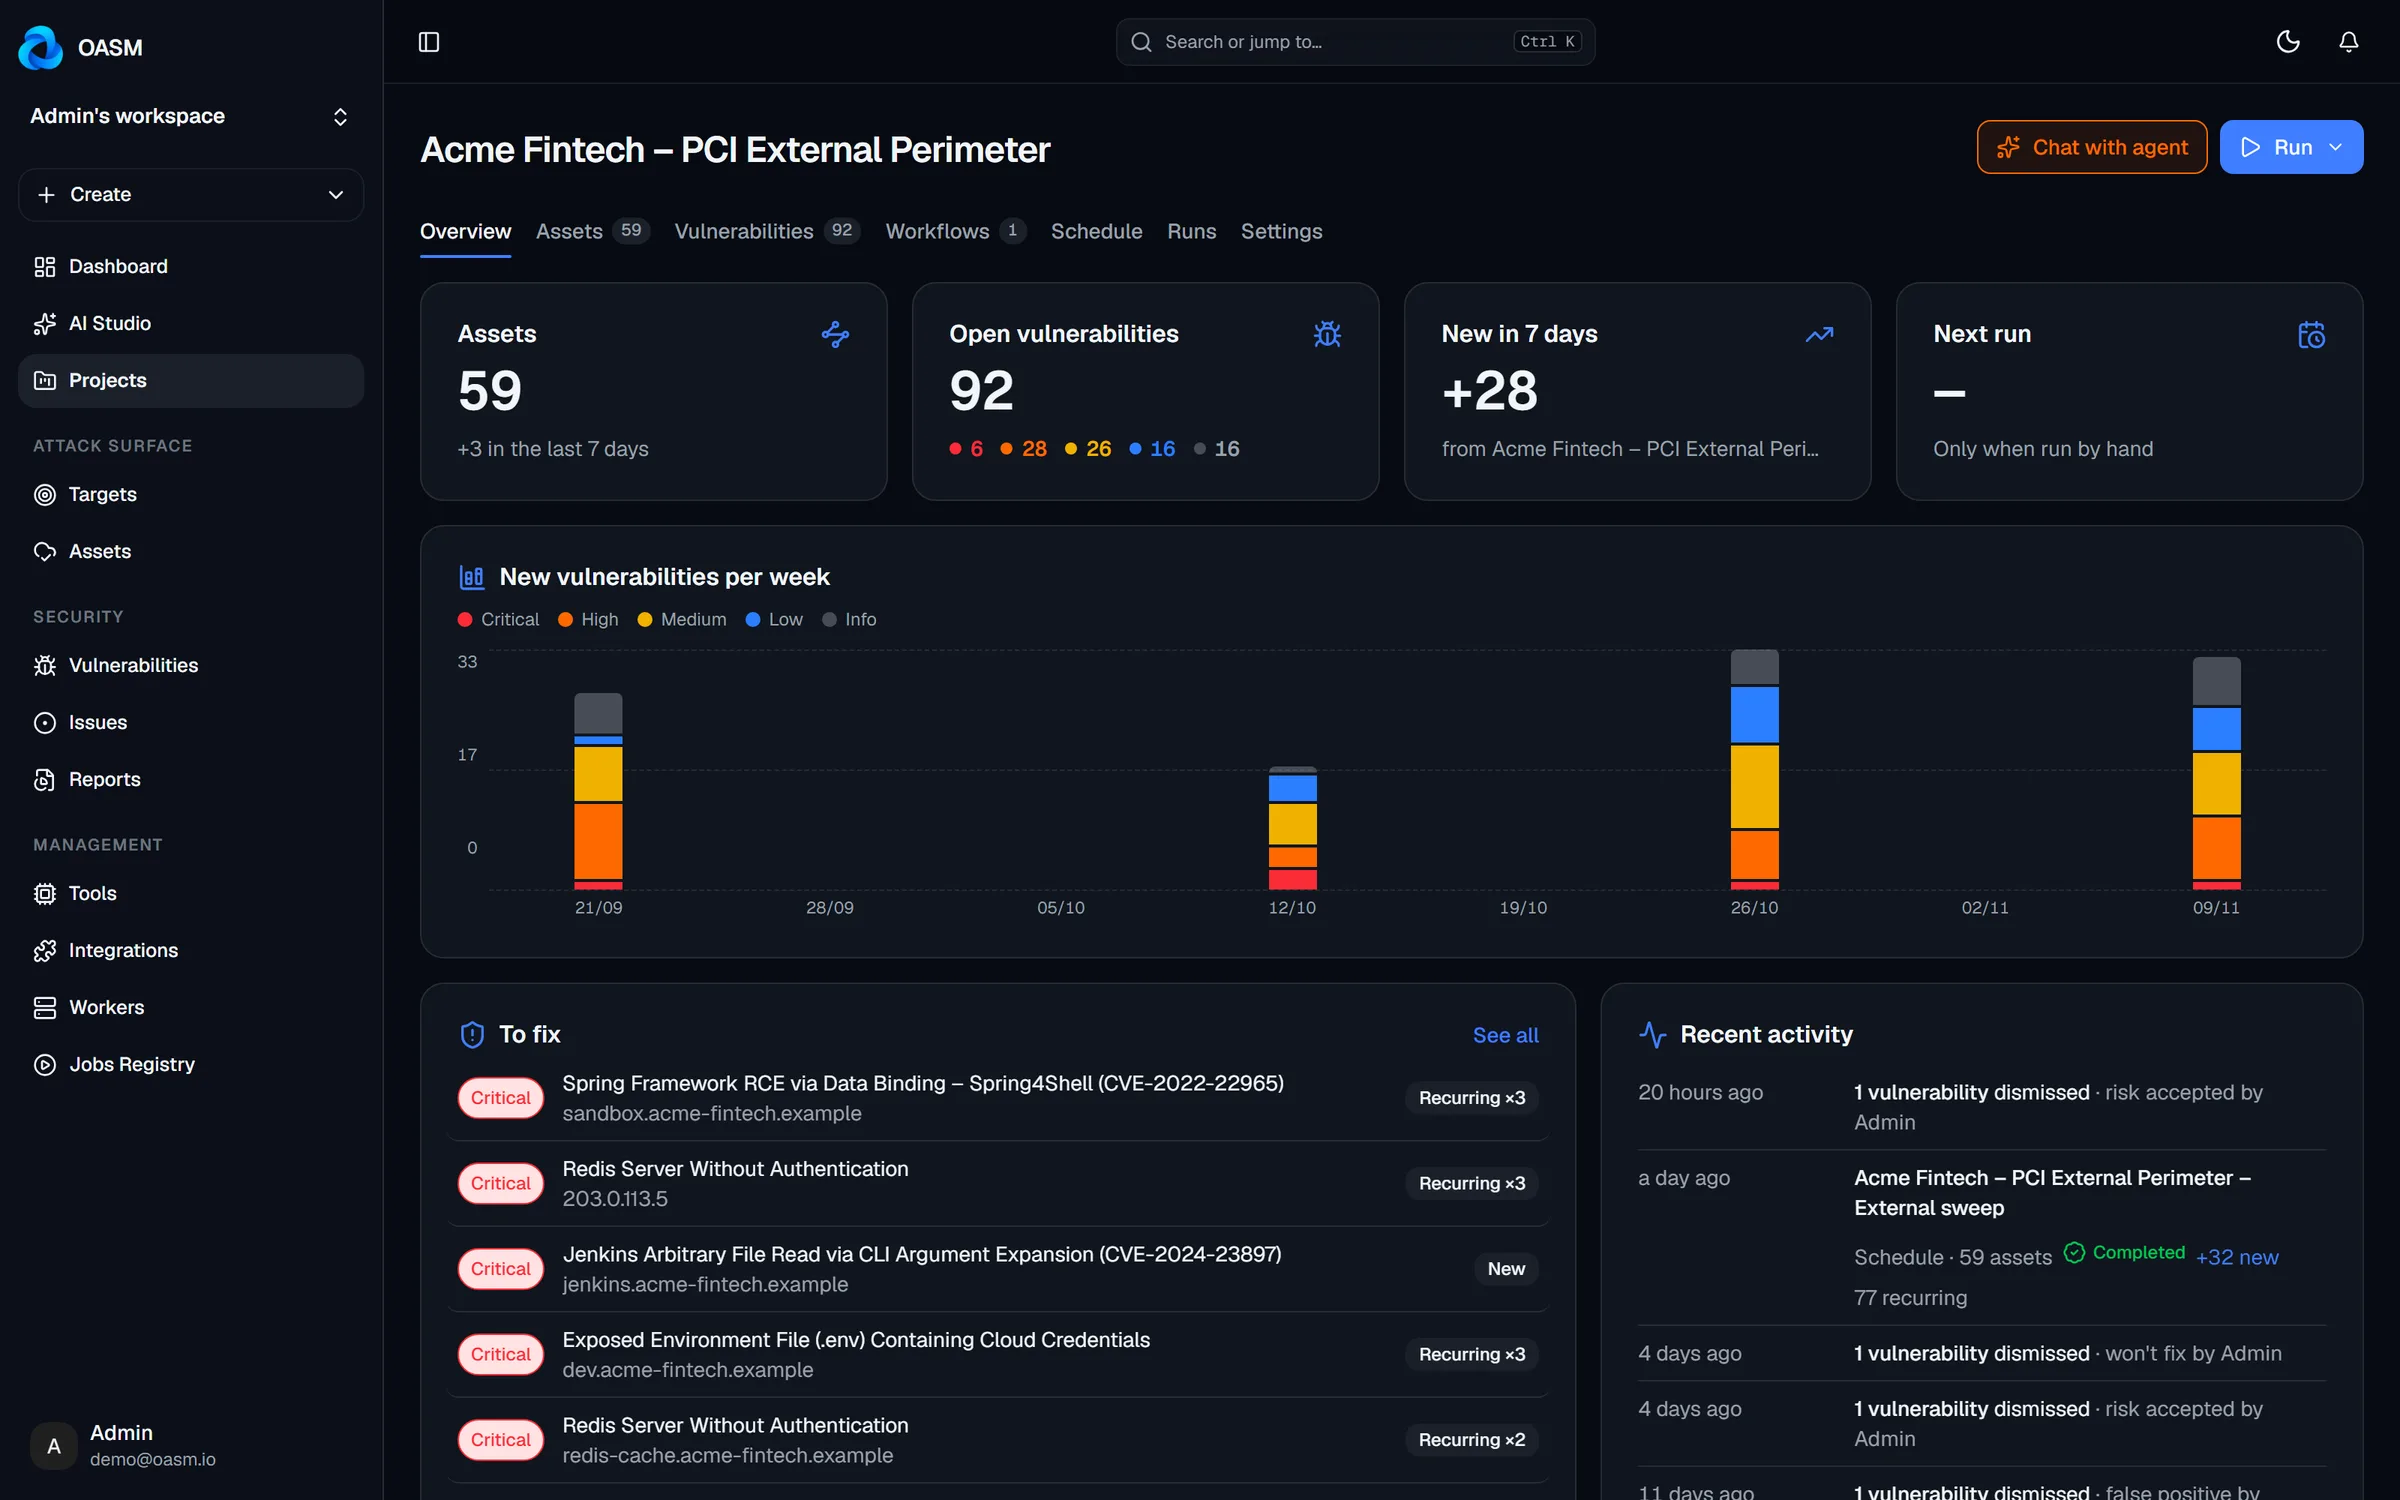
Each target gets the same view, scoped to its own assets.
The score and trend answer "are we getting better?"
Needs-attention and SLA status set the agenda.
Hand over a PDF report generated from live data.
From open vulnerabilities and their severity across the workspace, shown as a grade from A to F.
Free, open source and self-hosted. Your data never leaves your infrastructure.